RDP Honeypot
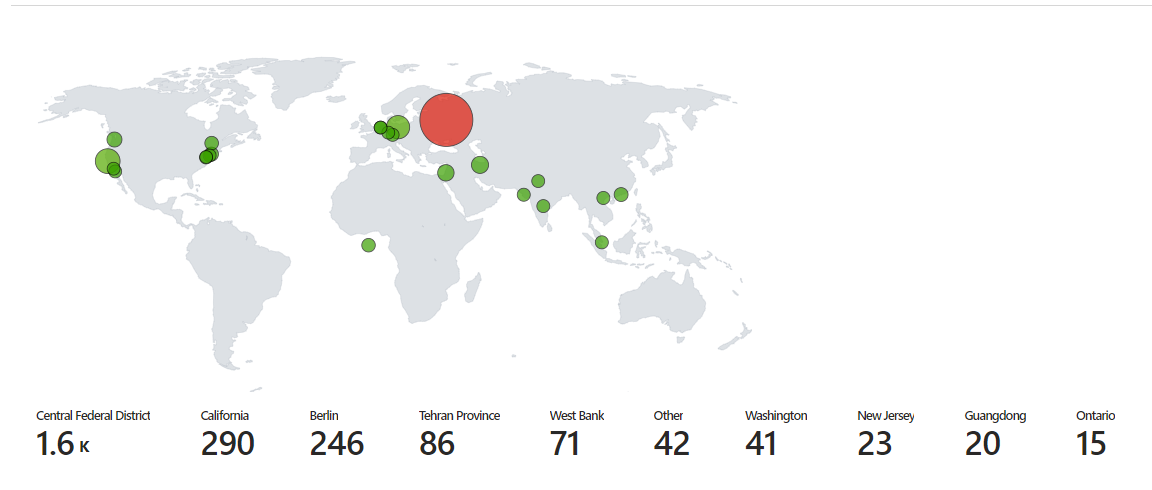
Above is a heat map displaying failed login attempts over a three day period. This was
recorded using system event viewer logs of failed login attempts. The IP addresses from these event logs were then sent to
an API called ipgeolocation.io which finds information on that IP including longitude, latitude, country, state, etc. This data is then
stored in a new log file created using a powershell script and sent to a table in Microsoft Azure using the log analytics workspace. In
a Microsoft Sentinel workbook, we query the table that we created with the data from our log file and plot in on the map above. The
query used is:
FAILED_RDP_WITH_GEO_CL
| extend username = extract(@"username:([^,]+)", 1, RawData),
timestamp = extract(@"timestamp:([^,]+)", 1, RawData),
latitude = extract(@"latitude:([^,]+)", 1, RawData),
longitude = extract(@"longitude:([^,]+)", 1, RawData),
sourcehost = extract(@"sourcehost:([^,]+)", 1, RawData),
state = extract(@"state:([^,]+)", 1, RawData),
label = extract(@"label:([^,]+)", 1, RawData),
destination = extract(@"destinationhost:([^,]+)", 1, RawData),
country = extract(@"country:([^,]+)", 1, RawData)
| where destination != "samplehost"
| where sourcehost != ""
| summarize event_count=count() by timestamp, label, country, state, sourcehost, username, destination, longitude, latitude
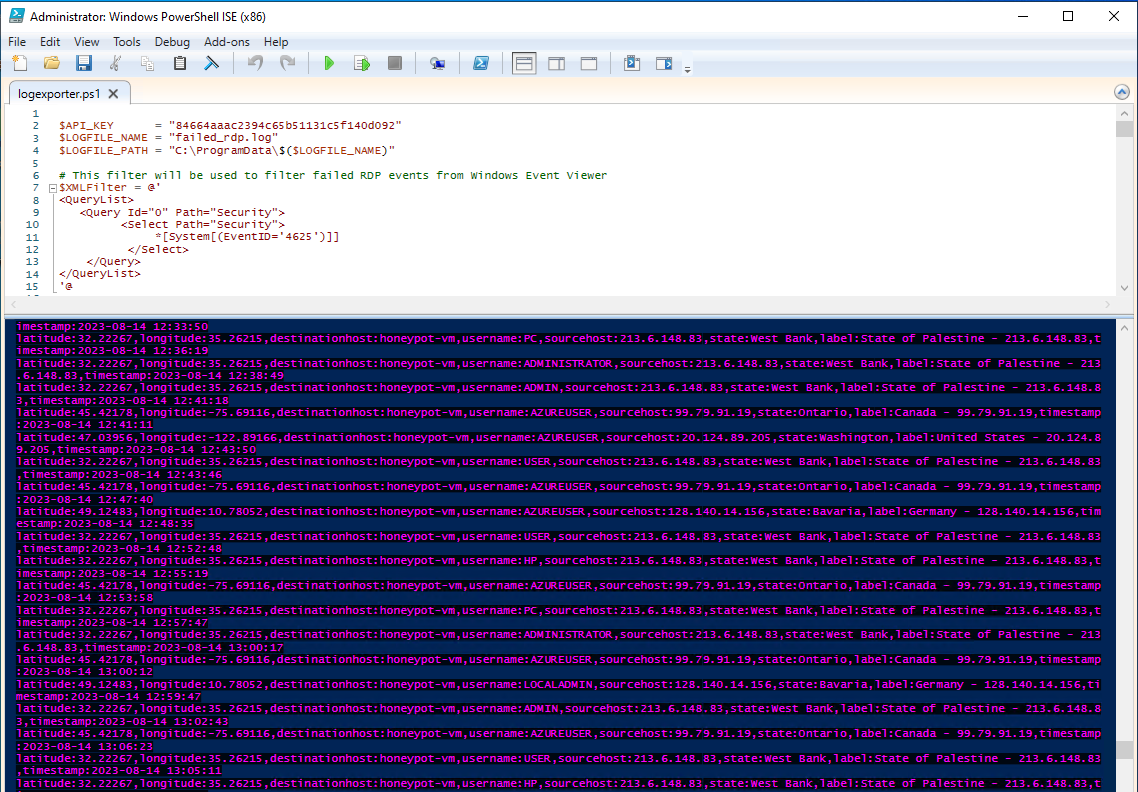
Above is a screenshot of the script saving RDP attempts in real time to the new log file. This is a simple example of intrusion detection and how log analysis can help security analysts find data on those who attempt to breach into private networks.